

Get a related visualization
URL: https://daac.ornl.gov/ABOVE/guides/ABoVE_Atmospheric_Flask_Data_Fig1.png
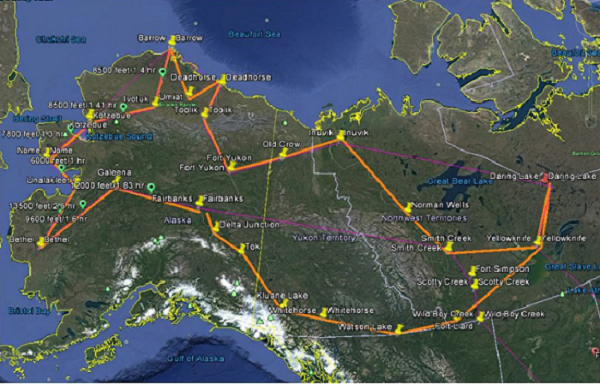
Arctic-CAP flight lines (orange) sample Arctic and boreal regions of Alaska and the Yukon and the Northwest Territories of Canada. Monthly campaigns extended from April through November, capturing the carbon dynamics of the 2017 growing season. Pins mark the locations of the 25 vertical profiles acquired during each monthly campaign. Source: Scientific Aviation, 2019.
Source: ABoVE: Atmospheric Gas Concentrations from Airborne Flasks, Arctic-CAP, 2017
About this Resource
| Last updated | unknown |
|---|---|
| Created | unknown |
| Name | Get a related visualization |
| Format | PNG Image File |
| License | License not specified |
| Created | 3 months ago |
| Media type | image/png |
| has views | True |
| id | 09e7ae0b-cf73-4166-8936-d776411af5ff |
| metadata modified | 3 months ago |
| package id | 3f6d5eb1-1886-4179-bc92-fc510bdd912e |
| position | 6 |
| state | active |
| tracking summary | {'total': 0, 'recent': 0} |