

TRMM (TMPA) Precipitation L3 1 day 0.25 degree x 0.25 degree V7 (TRMM_3B42_Daily) at GES DISC
Access & Use Information
Downloads & Resources
-
Google Scholar search resultsHTML
Search results for publications that cite this dataset by its DOI.
-
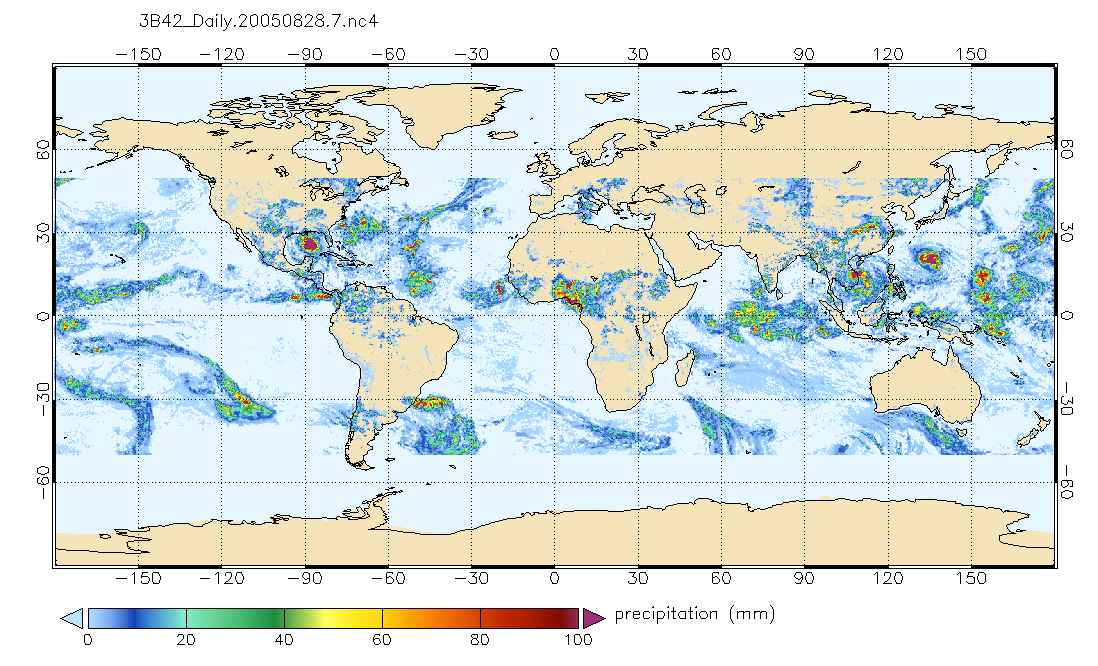
Get a related visualizationPNG
TRMM_3B42_Daily.png
-
This dataset's landing pageHTML
Access the dataset landing page from the GES DISC website.
-
Download this dataset through a directory mapHTML
Access the data via HTTPS
-
Download this dataset through Earthdata SearchHTML
Use the Earthdata Search to find and retrieve data sets across multiple data...
-
Use GRADS DATA SERVER (GDS) to access the...HTML
The GrADS Data Server (GDS) is another form of OPeNDAP that provides...
-
Use OPeNDAP to access the dataset's dataHTML
Access the data via the OPeNDAP protocol.
-
Use THREDDS DATA to download the dataset's dataHTML
Access the data via the THREDDS.
-
View information related to this datasetHTML
View frequently asked questions about TRMM.
-
View this dataset's read me documentPDF
README Document
-
View documentation related to this datasetPDF
Transition from Monthly TMPA to Climatological Calibration/Adjustment
-
View documentation related to this datasetPDF
Transition from TMPA to IMERG
-
View documentation related to this datasetHTML
TRMM Data Gaps
-
Landing PageLanding Page
References
| https://doi.org/10.1007/978-90-481-2915-7 |
Dates
| Metadata Created Date | February 22, 2025 |
|---|---|
| Metadata Updated Date | February 22, 2025 |
Metadata Source
- Data.json Data.json Metadata
Harvested from nasa test json
Additional Metadata
| Resource Type | Dataset |
|---|---|
| Metadata Created Date | February 22, 2025 |
| Metadata Updated Date | February 22, 2025 |
| Publisher | NASA/GSFC/SED/ESD/GCDC/GESDISC |
| Maintainer | |
| Identifier | C1239536905-GES_DISC |
| Data First Published | 2016-04-19 |
| Language | en-US |
| Data Last Modified | 2025-02-19 |
| Category | TRMM, geospatial |
| Public Access Level | public |
| Bureau Code | 026:00 |
| Metadata Context | https://project-open-data.cio.gov/v1.1/schema/catalog.jsonld |
| Schema Version | https://project-open-data.cio.gov/v1.1/schema |
| Catalog Describedby | https://project-open-data.cio.gov/v1.1/schema/catalog.json |
| Harvest Object Id | 157da44a-92f9-46b7-ad3f-900aa12fbebc |
| Harvest Source Id | a73e0c30-4684-40ef-908e-d22e9e9e5f86 |
| Harvest Source Title | nasa test json |
| Homepage URL | https://doi.org/10.5067/TRMM/TMPA/DAY/7 |
| Metadata Type | geospatial |
| Old Spatial | -180.0 -50.0 180.0 50.0 |
| Program Code | 026:001 |
| Related Documents | https://doi.org/10.1007/978-90-481-2915-7 |
| Source Datajson Identifier | True |
| Source Hash | 84088ec55787043da058beb9ef11132fd2e7b3fc5153a7d96a20cc0957a3a822 |
| Source Schema Version | 1.1 |
| Spatial | |
| Temporal | 1998-01-01T00:00:00Z/2022-01-17T00:00:00Z |
Didn't find what you're looking for? Suggest a dataset here.