

Get a related visualization
URL: https://daac.ornl.gov/ABOVE/guides/CircumArctic_Trends_Hotspots_Fig1.jpg
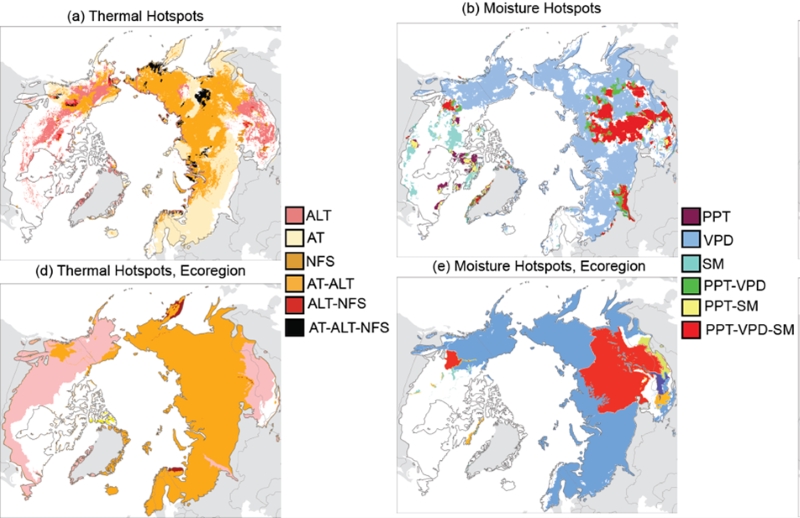
Multivariate change hotspot maps for the 1997 to 2020 period, according to select directional changes in thermal, moisture, and vegetation indicators. Thermal indicator includes: average increase in annual air temperature (AT, degrees C); increase in annual non-frozen season (NFS, days); and increase in annual active layer thickness (ALT, m). Moisture indicator includes: decrease in annual precipitation (PPT, mm); increase in annual vapor pressure deficit (VPD, kPa); and a decrease in annual non-frozen season soil moisture (SM, cm3 cm-3). Panels (a) and (b) show identified change based on pixel-level analyses; (d) and (e) show indicator change across individual ecoregions.
Source: Trends of Thermal, Wetness, and Vegetative Change in the Circumpolar Arctic
About this Resource
| Last updated | unknown |
|---|---|
| Created | unknown |
| Name | Get a related visualization |
| Format | JPEG Image File |
| License | License not specified |
| Created | 3 months ago |
| Media type | image/jpeg |
| has views | True |
| id | 42397e4d-47c1-4b71-88df-53677c4dce50 |
| metadata modified | 3 months ago |
| package id | 010d18cf-be3a-4285-b720-63b82b9b0577 |
| position | 19 |
| state | active |
| tracking summary | {'total': 0, 'recent': 0} |