

Get a related visualization
URL: https://daac.ornl.gov/NACP/guides/SOC_Stocks_Great_Plains_Fig1.png
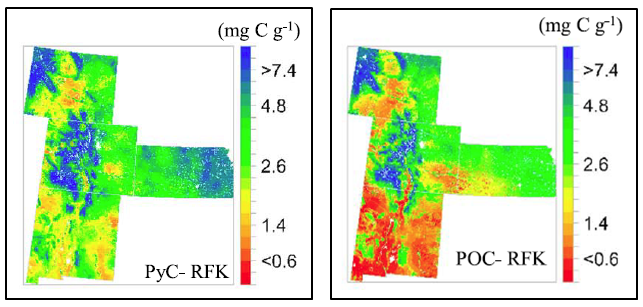
Spatial distributions of observed pyrogenic soil carbon (left) and observed particulate carbon (right) in mg C/g soil. The X and Y coordinates (easting and northing) are in meters.
Source: Stocks of Surface Soil Organic Carbon Fractions, Great Plains Region, USA, 2007-2010
About this Resource
| Last updated | unknown |
|---|---|
| Created | unknown |
| Name | Get a related visualization |
| Format | PNG Image File |
| License | License not specified |
| Created | 3 months ago |
| Media type | image/png |
| has views | True |
| id | 597d264f-6b38-4782-83ab-f7ed904d00a3 |
| metadata modified | 3 months ago |
| package id | 0f324261-e435-4b03-96f0-49303417f77b |
| position | 6 |
| state | active |
| tracking summary | {'total': 0, 'recent': 0} |