

Get a related visualization
URL: https://daac.ornl.gov/ABOVE/guides/PermafrostThaw_CarbonEmissions_Fig1.jpg
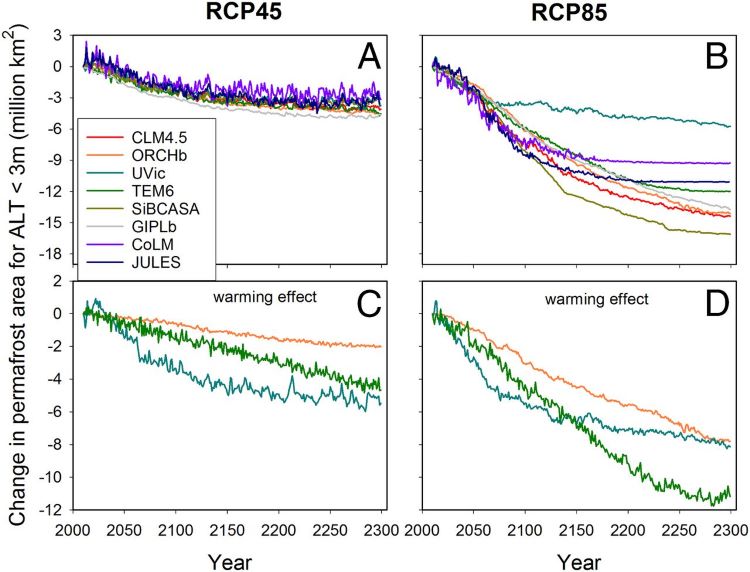
Changes in simulated permafrost dynamics. Simulated cumulative changes in (A and B) permafrost area for active layer thickness (ALT) less than 3 m from 2010-2299 and (C and D) the sensitivity of simulated changes in permafrost area to changes in mean annual air temperature for RCP4.5 (left column) and RCP8.5 (right column) model projections. Source: McGuire et al. (2018; Fig. 2)
Source: Projections of Permafrost Thaw and Carbon Release for RCP 4.5 and 8.5, 1901-2299
About this Resource
| Last updated | unknown |
|---|---|
| Created | unknown |
| Name | Get a related visualization |
| Format | JPEG Image File |
| License | License not specified |
| Created | 3 months ago |
| Media type | image/jpeg |
| has views | True |
| id | 761f2623-768d-4f23-a50a-6d312d4f21c5 |
| metadata modified | 3 months ago |
| package id | 46d2755e-1e14-4d14-81eb-5edecb909433 |
| position | 7 |
| state | active |
| tracking summary | {'total': 0, 'recent': 0} |