

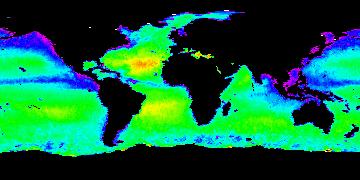
Aquarius CAP Level 3 Sea Surface Salinity Standard Mapped Image Monthly Data V5.0
Access & Use Information
Public: This dataset is intended for public access and use.
Non-Federal: This dataset is covered by different Terms of Use than Data.gov.
License: No license information was provided.
Downloads & Resources
-
Google Scholar search resultsHTML
Search results for publications that cite this dataset by its DOI.
-
View documentation related to this datasetHTML
NASA Aquarius/SAC-D mission website
-
View this dataset's user's guidePDF
Aquarius CAP V5.0 Algorithm and Data Users Guide
-
Get a related visualizationJPEG
Thumbnail
-
View documentation related to this datasetHTML
Mission and Instrument Overview
-
View this dataset's data citation policyHTML
Data Use and Citation Policy
-
Download this dataset through a directory mapHTML
HTTPS endpoint for data browse and download
-
Download this dataset through Earthdata SearchHTML
Browse granule search results in Earthdata Search
-
View documentation related to this datasetPDF
ATBD, Validation & Uncertainty Analyses, Publications, etc
-
View this dataset's data recipesHTML
Generic data readers
-
Landing PageLanding Page
Dates
| Metadata Created Date | February 22, 2025 |
|---|---|
| Metadata Updated Date | February 22, 2025 |
Metadata Source
- Data.json Data.json Metadata
Harvested from nasa test json
Additional Metadata
| Resource Type | Dataset |
|---|---|
| Metadata Created Date | February 22, 2025 |
| Metadata Updated Date | February 22, 2025 |
| Publisher | NASA/JPL/PODAAC |
| Maintainer | |
| Identifier | C2491756350-POCLOUD |
| Data First Published | 2018-08-22 |
| Language | en-US |
| Data Last Modified | 2025-02-19 |
| Category | AQUARIUS SAC-D, geospatial |
| Public Access Level | public |
| Bureau Code | 026:00 |
| Metadata Context | https://project-open-data.cio.gov/v1.1/schema/catalog.jsonld |
| Schema Version | https://project-open-data.cio.gov/v1.1/schema |
| Catalog Describedby | https://project-open-data.cio.gov/v1.1/schema/catalog.json |
| Harvest Object Id | 6020f39a-84a2-4c47-9844-a22456ec9484 |
| Harvest Source Id | a73e0c30-4684-40ef-908e-d22e9e9e5f86 |
| Harvest Source Title | nasa test json |
| Homepage URL | https://doi.org/10.5067/AQR50-3TMCS |
| Metadata Type | geospatial |
| Old Spatial | -180.0 -90.0 180.0 90.0 |
| Program Code | 026:001 |
| Source Datajson Identifier | True |
| Source Hash | c7b27e666b4492734d49142591e255b2d9a0d8705823ac5511640ec03a75056a |
| Source Schema Version | 1.1 |
| Spatial | |
| Temporal | 2011-09-01T00:00:00Z/2015-06-01T00:00:00Z |
Didn't find what you're looking for? Suggest a dataset here.