

Get a related visualization
URL: https://daac.ornl.gov/ABOVE/guides/SAR_Methane_Ebullition_AK_Fig1.png
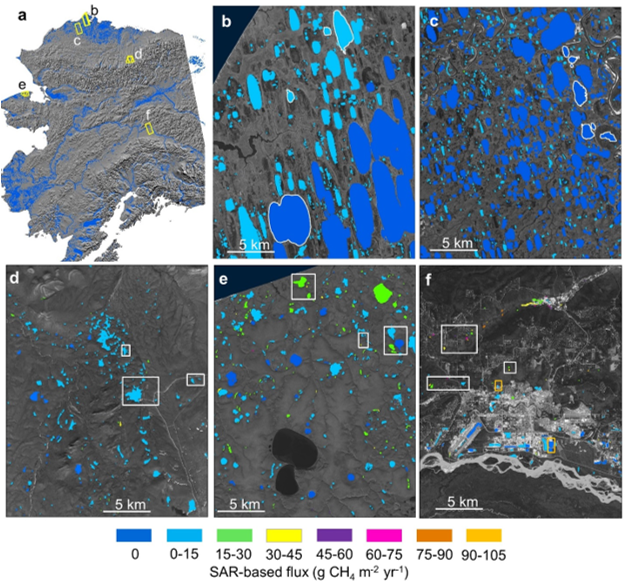
SAR-based lake ebullition maps. Panel A shows Alaska study regions with SAR footprints outlined in yellow. Subsequent panels show SAR-based CH4 ebullition maps for B) Barrow Peninsula, C) Atqasuk, D) Toolik, E) northern Seward Peninsula, and F) Fairbanks. Study lakes with field-based measurements are outlined (B,C) or boxed (D,E,F) in white. Orange boxes in panel F indicate anthropogenic study lakes. Source: Engram et al. (2020).
Source: ABoVE: SAR-based Methane Ebullition Flux from Lakes, Five Regions, Alaska, 2007-2010
About this Resource
| Last updated | unknown |
|---|---|
| Created | unknown |
| Name | Get a related visualization |
| Format | PNG Image File |
| License | License not specified |
| Created | 3 months ago |
| Media type | image/png |
| has views | True |
| id | 8bae197a-7964-4f02-b738-db2e431647a4 |
| metadata modified | 3 months ago |
| package id | 40c854fc-20c2-41ef-bcb3-78f800020545 |
| position | 10 |
| state | active |
| tracking summary | {'total': 0, 'recent': 0} |